
Troubleshoot Slow Applications With Packet Captures
 Oliver Ripka
To troubleshoot a slow application with packet captures, split the transaction into DNS, connection setup, TLS, request delivery, service wait, response transfer, and teardown. Measure each stage, compare a successful baseline, and only blame the network when packet evidence supports that ownership.
“The application is slow” is a symptom. The delay may come from name resolution, path latency, packet recovery, a constrained receiver, TLS setup, server processing, a downstream dependency, or the client itself. A packet trace can separate many of these, but only from the boundary it observes.
This article starts once you have a capture. For the cheaper checks that come first, and for deciding whether a capture is worth taking, read how to troubleshoot slow applications. For where APM, observability, and network monitoring end and packets begin, read platforms for root-cause analysis in IT teams.
Capture the affected transaction and a baseline
The most useful capture contains:
- the affected client and service
- a narrow time window around the symptom
- both directions of traffic
- an interface close enough to answer the ownership question
- at least one successful or acceptably fast comparison
- the user's timestamp or transaction identifier
When ownership is disputed, capture at two points if possible: near the client and near the service, or on both sides of a proxy, firewall, load balancer, or WAN boundary. One capture can identify where delay appears. Two synchronized captures can locate where it was introduced.
Record capture drops, packet slicing, time synchronization, and NIC offloading. A missing packet at the analyzer is not automatically a lost packet on the network.
Build the transaction timeline
Start with milestones rather than aggregate statistics:
| Stage | Start | End | What the gap can indicate |
|---|---|---|---|
| DNS | query | usable response | resolver, path, retry, or name-resolution delay |
| TCP setup | SYN | final handshake ACK | RTT, loss, filtering, backlog, or path asymmetry |
| TLS setup | ClientHello | completed handshake | RTT, crypto, certificate, policy, or server delay |
| Request delivery | first request byte | final request byte acknowledged | upload path, loss, receiver window, or client pacing |
| Service wait | complete request | first response byte | server, application, storage, or downstream dependency |
| Response transfer | first response byte | final response byte acknowledged | throughput, loss, congestion, receiver, or application pacing |
| Close or retry | final data | FIN, reset, timeout, or new attempt | normal close, abort, policy action, or retry logic |
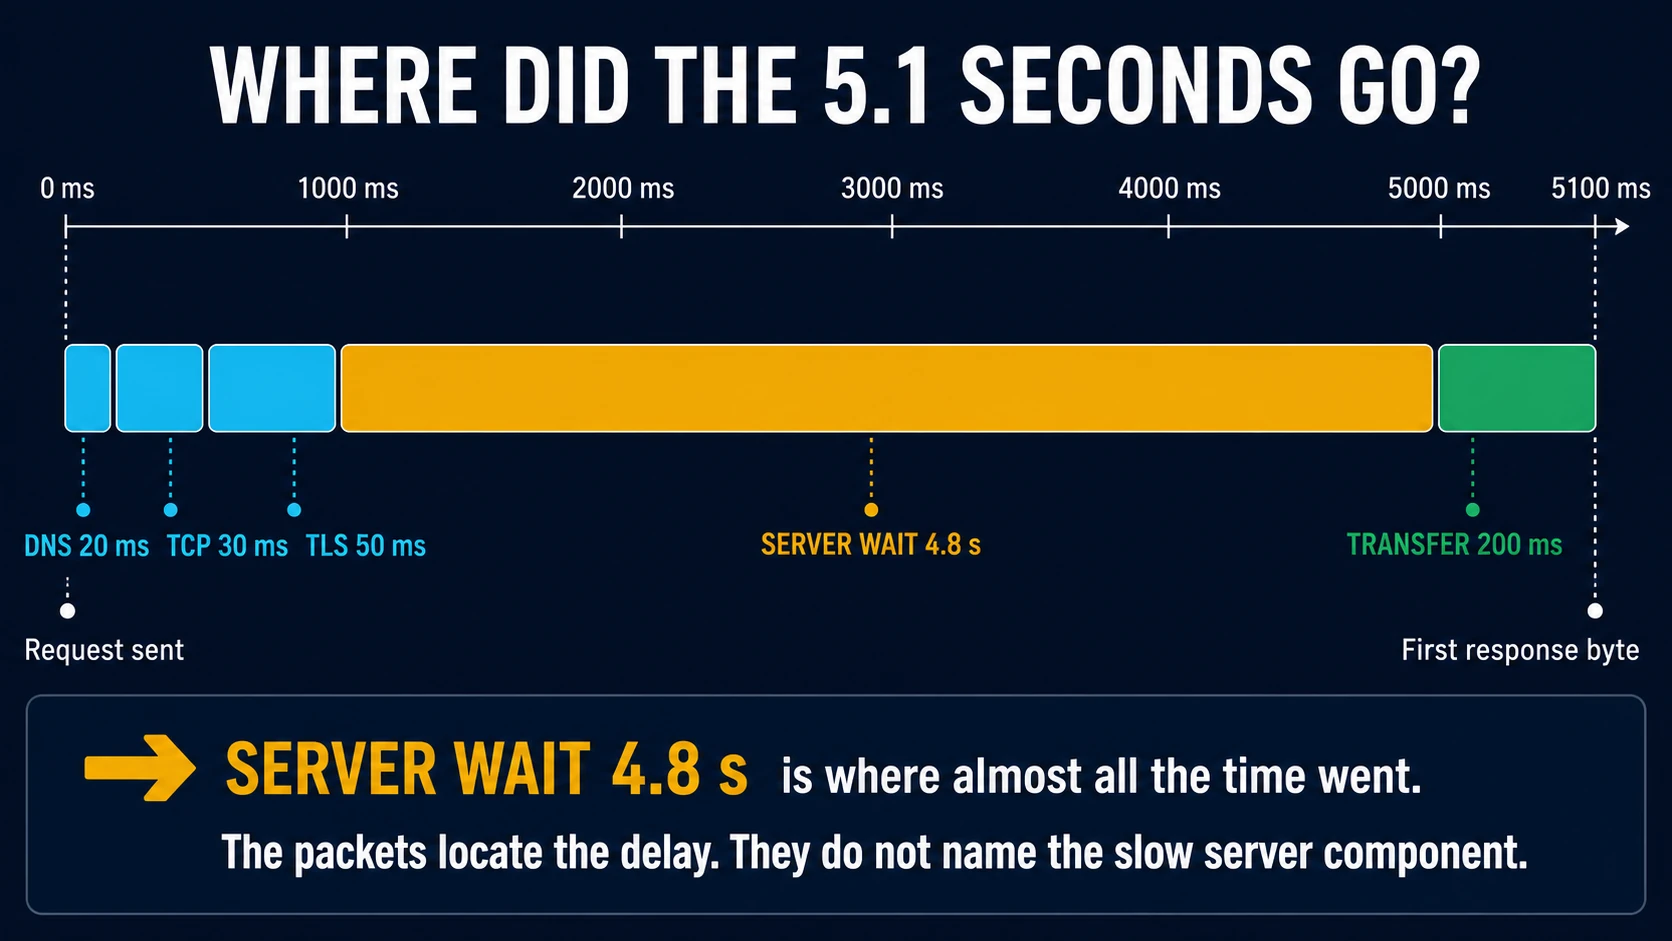
This example locates almost all delay between the completed request and first response byte. The packets establish the boundary, but not the slow internal server component.
Add a delta-time column in Wireshark and follow the relevant stream. For TCP, graphs help show sequence progress, outstanding data, RTT, and throughput. The practical PCAP workflow explains how to isolate the correct transaction first.
DNS delay
Inspect query and response timing, retries, response codes, CNAME chains, A and AAAA behavior, and which resolver answered. Useful filters include:
dns
dns.flags.response == 0
dns.flags.rcode != 0
Do not attribute a long gap to DNS merely because DNS appears earlier in the trace. Confirm the application actually waited for that answer and did not use a cached address or race multiple connection attempts.
TCP connection setup
Measure SYN to SYN/ACK and the completed three-way handshake. Compare it with the established path RTT. A repeated SYN can indicate loss, filtering, an unavailable listener, or a return path the capture cannot see.
Useful filters:
tcp.flags.syn == 1
tcp.analysis.retransmission
tcp.flags.reset == 1
A delayed SYN/ACK near the client does not identify where the delay occurred. A synchronized server-side capture can show whether the SYN arrived late or the server replied late.
TLS setup
Separate TCP establishment from the TLS handshake. Inspect ClientHello, ServerHello, alerts, resets, retries, and the number of round trips required. Modern TLS payload may be encrypted, but the handshake sequence and transport timing can still show whether the connection fails before application data begins.
Server certificate processing, client authentication, policy devices, session resumption, and missing packets can all change the visible timing. Compare failed and successful handshakes through the same capture point.
Server or downstream service wait
One of the most useful packet-analysis measurements is the gap between a complete request reaching the service and the first response byte leaving it.
If the request is fully acknowledged, no transport recovery overlaps the gap, and the first response appears seconds later, the visible network path is not consuming most of that time. The delay may be in the server, application, database, identity provider, storage system, or another dependency beyond the capture boundary.
Phrase the conclusion carefully:
The selected capture supports service-side wait after request delivery. It does not identify which internal component consumed the time.
That is more defensible than “the server is slow,” especially when a proxy or load balancer terminates the observed connection.
Transfer delay and TCP recovery
During a response transfer, inspect:
- sequence progress over time
- RTT and RTT variation
- retransmitted byte ranges
- duplicate ACK and SACK behavior
- retransmission timeout or fast recovery
- congestion-window behavior when inferable
- receiver advertised window
- zero-window and window-update events
- application pauses between writes
The presence of retransmissions does not establish that they caused the user's delay. Correlate each recovery period with a flat section in sequence progress, reduced throughput, or the application timeout.
Similarly, a small advertised receive window can limit throughput without any packet loss. Repeated application pauses with no outstanding data may instead indicate sender-side pacing or delayed generation of content.
Client-side constraints
The client can introduce delay through slow reads, a constrained receive buffer, CPU pressure, local proxying, connection pooling, or application retry behavior. Packet evidence may show:
- a shrinking receive window
- zero-window advertisements
- delayed acknowledgments consistent with the endpoint stack
- long gaps before the client sends the next request
- resets or FINs initiated from the client side
An endpoint capture may provide additional process context, but offloading can also alter how segments appear. Keep the wire and host views distinct.
Compare a healthy baseline
The best comparison holds as many variables constant as possible:
- same client and server role
- same request type and approximate size
- same capture point
- similar network path and time window
- same TLS and application behavior
Compare milestone timing, RTT, loss recovery, receiver window, response size, and server wait. A problem flow with 40 ms RTT and a 4-second post-request gap should not be blamed on latency when healthy flows have the same RTT and a 60 ms service wait.
Where enterprise platforms fit
Omnipeek emphasizes packet-led performance analysis, distributed capture, Wi-Fi, voice, video, and visualizations. NETSCOUT nGeniusONE provides continuous service assurance and application and session analysis from packet-derived Smart Data. ExtraHop RevealX combines performance records with optional packet forensics.
These platforms are valuable when continuous context and an operated sensor estate are required. Wireshark remains strong for unrestricted manual packet inspection. PacketSafari fits when the team already has an incident PCAP and needs an evidence-backed root-cause investigation and report.
Report ownership without overclaiming
A useful result assigns one of four directions:
- Network primary cause: packet evidence directly supports a path or transport failure as the main cause.
- Network contributing factor: the network added measurable delay or recovery but does not explain the whole symptom.
- No captured network fault: the selected transaction shows no material path or transport failure within visible coverage.
- Inconclusive: capture position, missing traffic, encryption, or conflicting evidence prevents ownership.
The packet evidence verification standard shows how to attach exact proof and uncertainty to that verdict.
PacketSafari performance analysis builds transaction timelines across network delay, TCP recovery, TLS setup, service wait, and receiver constraints. Evaluate it with the same affected and healthy captures you would use to validate any root-cause tool.