
Pcap analysis tool comparison
A Wireshark alternative for the investigations Wireshark makes slow.
We teach Wireshark and we still reach for it every week. It is the reference packet analysis tool: fully manual, fully in your control, and it shows you the exact packet details. That is also its cost. Every step depends on the analyst, and reading a trace well takes real expertise and years of training.
PacketSafari is an online AI pcap analyzer that starts where the manual work begins. Its Signal Scan and Triage Modules build an Evidence Map of the PCAP and highlight known errors and anomalies directly, for the whole capture and for each connection, with actionable views for VoIP, telco, TCP troubleshooting, and security. On top of that, Agent runs a fully automatic agentic analysis and reports back with exact packet evidence you can verify yourself, in the browser or back in Wireshark.
When Wireshark is the right tool
- A trained analyst wants direct, interactive control over display filters, streams, decoded fields, and packet bytes. Nothing shows exact packet detail better.
- The capture is already focused and you know which question to ask it.
- You are learning protocols. Nothing builds packet intuition like working through a trace yourself.
- The investigation must stay on one desktop and no shared workflow is needed.
Where the manual workflow costs you
Everything is manual
Wireshark is fast at loading and displaying packets. The work that takes time is everything around that: deciding which filter to type, which of the thousands of conversations to open, and what a decoded field actually means for the incident. The investigation plan, the correlation, and the interpretation all run through the analyst.
Expertise is the real dependency
Reading a trace well takes years of protocol knowledge and serious training. Wireshark expert info flags generic events, but recognizing a known failure pattern in VoIP signaling, a telco control-plane exchange, TCP recovery, or attacker traffic is knowledge the tool assumes you already have.
No map of the capture
The packet list shows packets, not the shape of the capture. Which protocols are present, which connections misbehave, and where the known errors and anomalies sit is a picture the analyst builds in their head, one filter at a time.
Defensible reporting and handoff
A screenshot of a filtered packet list is not a report. Turning findings into a chronology another engineer, a vendor, or an auditor can reproduce takes hours of manual writing, and escalating a desktop session means exporting, re-explaining, and losing context.
What the Evidence Map looks like
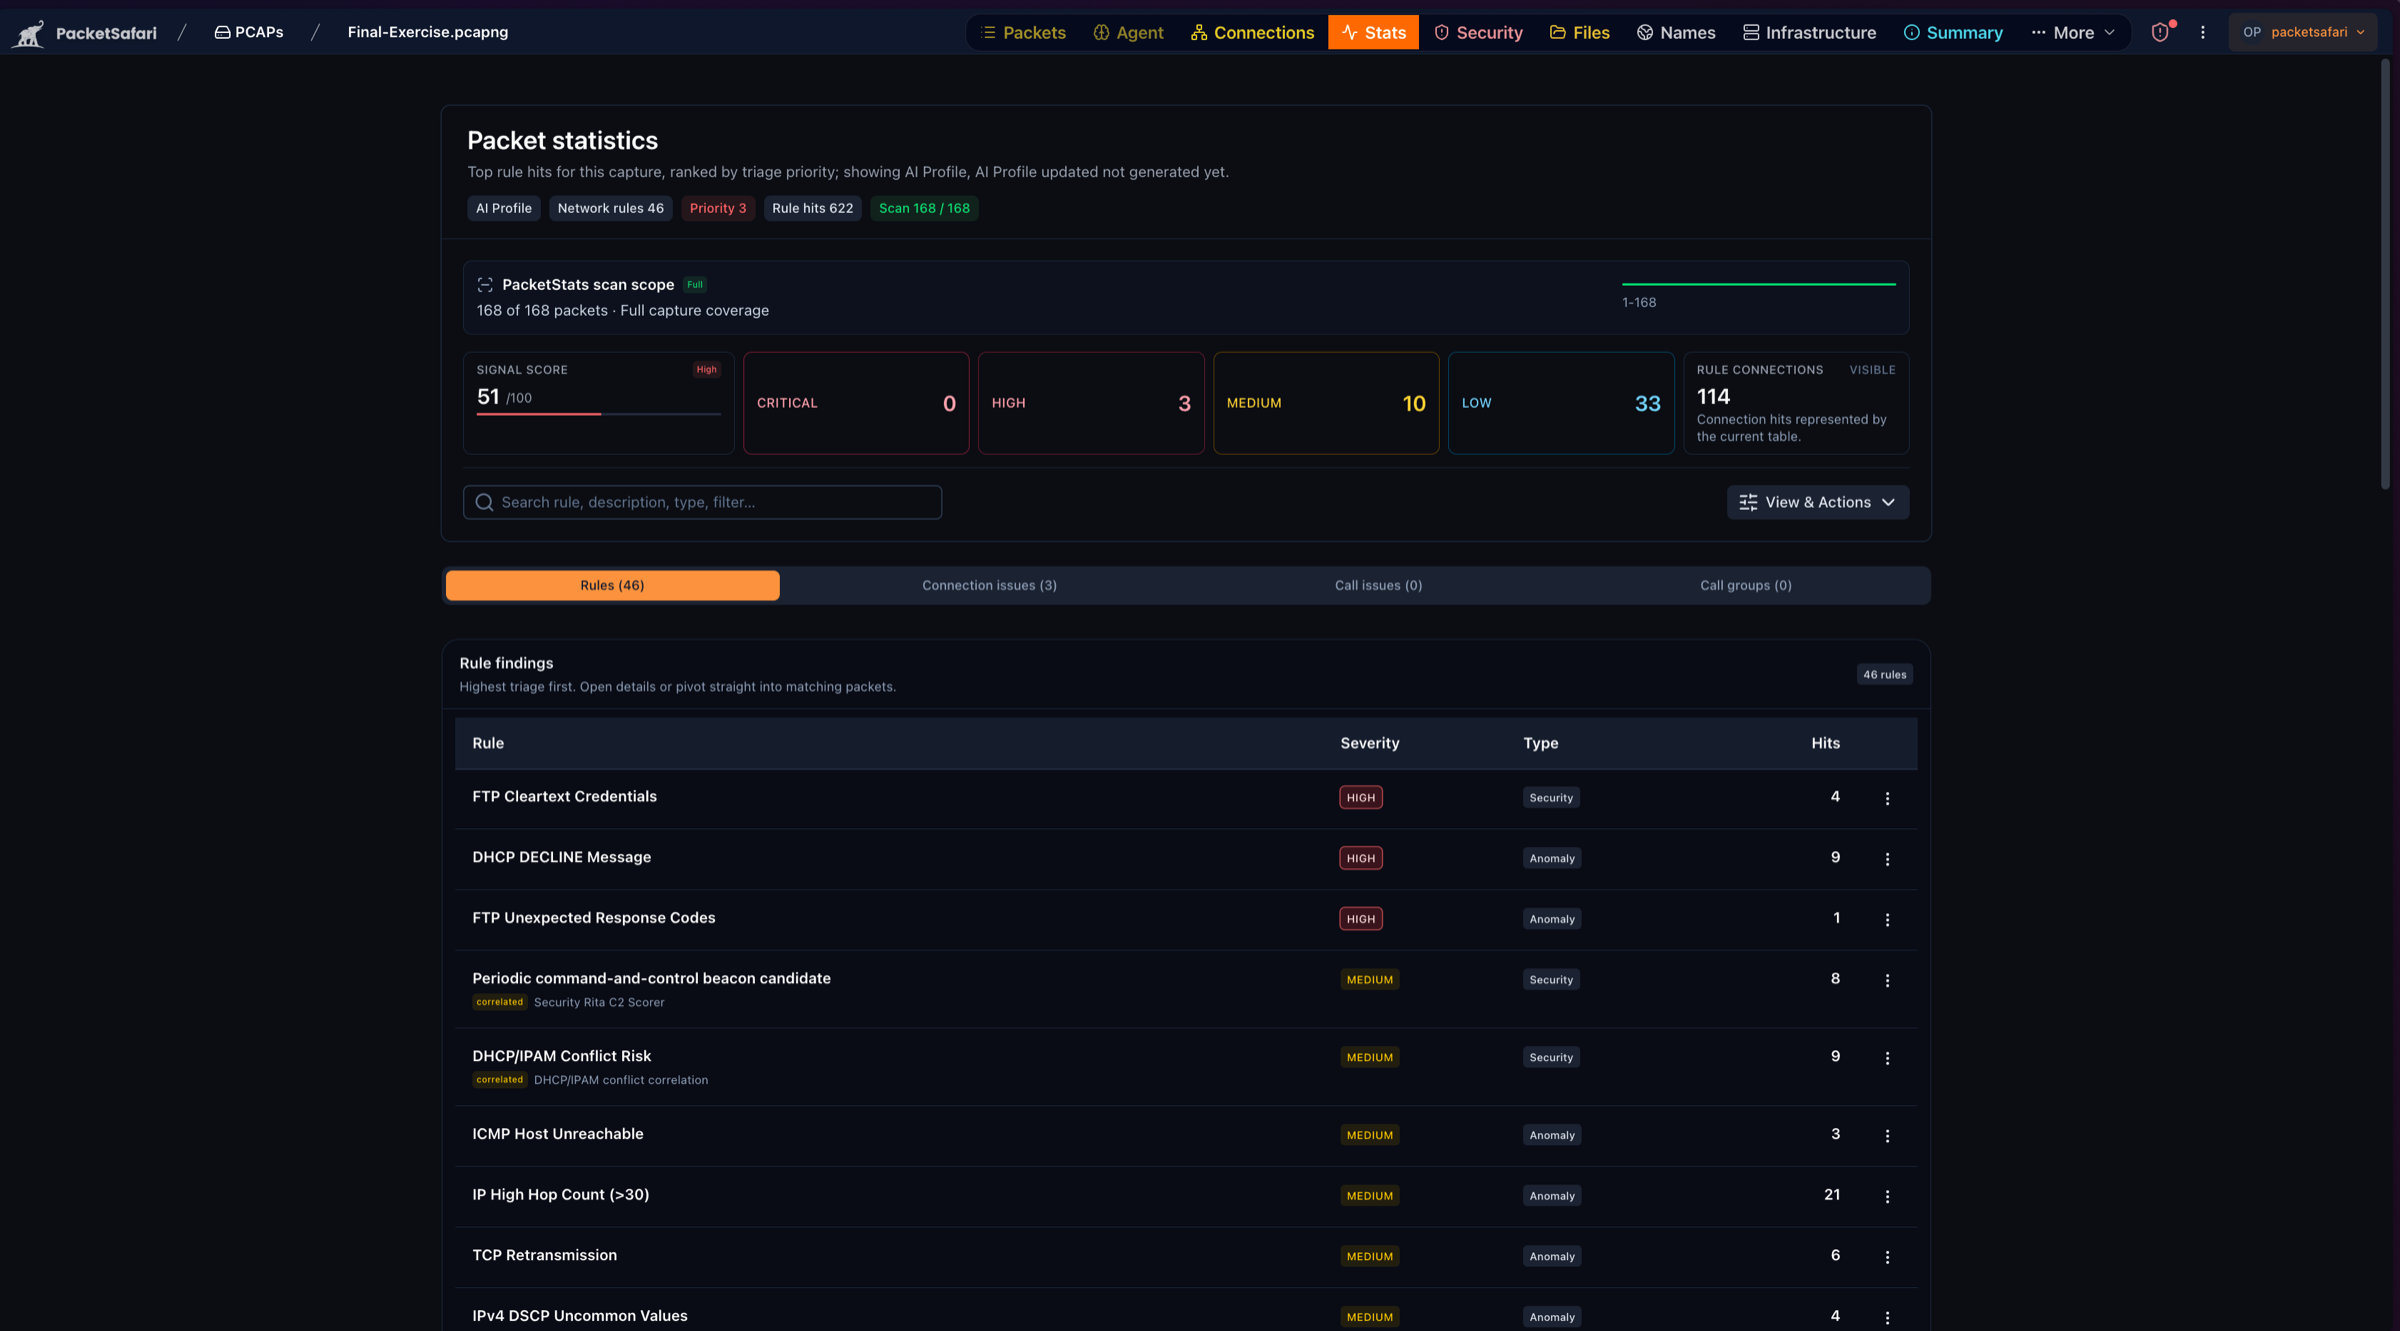
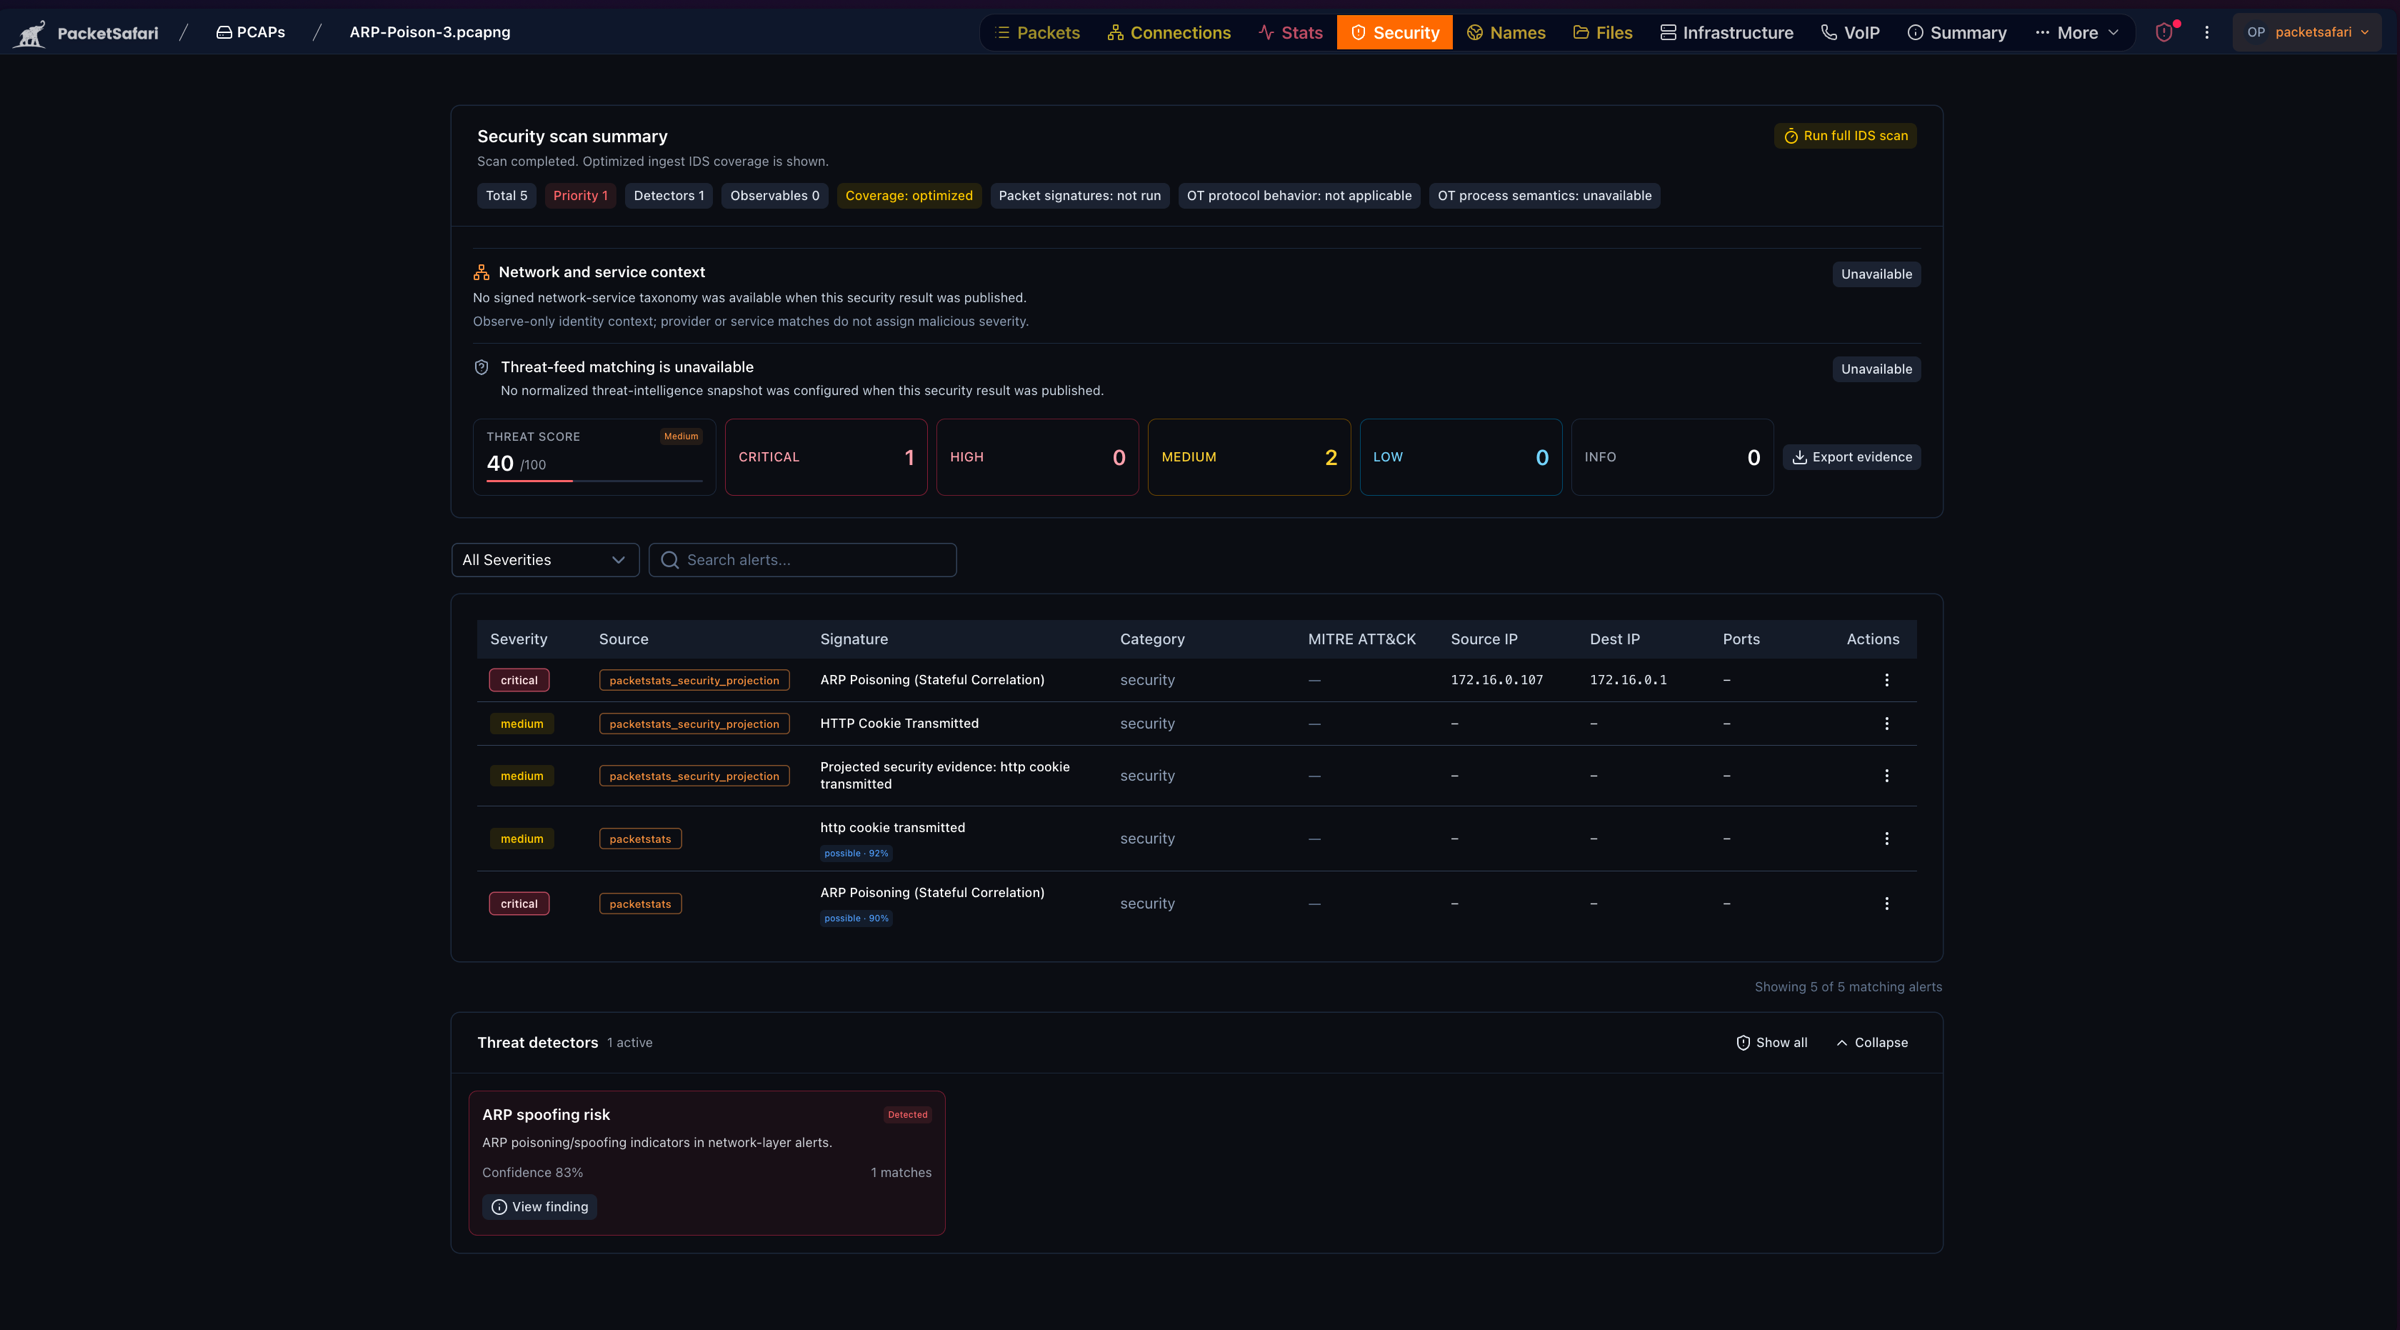
Wireshark and PacketSafari by investigation job
| The job | Wireshark | PacketSafari |
|---|---|---|
| See what is in the capture | Fast packet list and statistics menus; building the picture is manual | Signal Scan and Triage Modules build an Evidence Map: protocols, connections, known errors, and anomalies highlighted directly |
| Spot known errors and anomalies | Generic expert info; recognizing the failure pattern is on the analyst | Highlighted for the whole capture and for each connection |
| Domain-specific troubleshooting | Manual filter craft per protocol family | Actionable views for VoIP, telco, TCP troubleshooting, security, and more |
| Find root cause under time pressure | Depends fully on analyst time and expertise | AI-guided investigation with labelled preliminary direction, then independent verification |
| Security review of a suspicious capture | Manual filter craft per hypothesis | Signatures, behavioral C2, tunnels, and attack paths with explicit coverage |
| Fully automatic analysis | Not the model; every step is interactive | Agent runs the investigation end to end and reports with exact packet evidence |
| Hand a finding to another engineer | Screenshots and a pcap attachment | A reviewable chronology with frames, filters, flows, timestamps, and uncertainty attached |
| Keep packet data inside a controlled boundary | Local by default | Managed SaaS, dedicated SaaS, or fully on-premises with private AI |
Keep Wireshark. Add an investigation layer.
- 01
Upload the capture
Slice or anonymize on upload if the payload is sensitive. Free evaluation uploads are available.
- 02
Triage Modules build the Evidence Map
Protocols, connections, known errors, and anomalies are highlighted directly, for the whole capture and for each connection, with actionable views for VoIP, telco, TCP troubleshooting, and security.
- 03
Investigate with exact evidence
Every conclusion points at frames, fields, and timestamps. Preliminary direction is labelled as preliminary until verification completes.
- 04
Drop back into Wireshark any time
Findings come with the display filters to reproduce them, so the deep manual inspection happens exactly where it is strongest.
Whether the capture holds a TCP retransmission storm, a slow application nobody can attribute, or traffic that needs a malware analysis pass, the evidence standard is the same: frames, filters, flows, timestamps, coverage, and uncertainty stay attached to every material conclusion.