
How to Analyze a PCAP File: A Practical Workflow
 Oliver Ripka
To analyze a PCAP file reliably, start with the question and the capture boundary, not with a random display filter. A good workflow narrows the traffic in stages, tests more than one explanation, and keeps the final conclusion attached to packets another analyst can inspect.
The process below works whether you use Wireshark, command-line tools, an online PCAP analyzer, or an enterprise packet-investigation system. The interface changes. The evidence standard should not.
The eight-step PCAP analysis workflow
| Step | Question | Useful output |
|---|---|---|
| 1. Define the incident | What failed, for whom, and when? | A technical question and time window |
| 2. Validate the capture | What traffic could this trace actually observe? | Capture position, drops, truncation, and clock limits |
| 3. Inventory the traffic | Which endpoints, protocols, and conversations dominate? | A compact map of the capture |
| 4. Find the affected exchange | Which flow represents the reported symptom? | One or more bounded streams or transactions |
| 5. Build a timeline | Where is time spent and where does behavior diverge? | DNS, transport, TLS, application, and teardown milestones |
| 6. Test hypotheses | Which explanations fit all visible packets? | Supported and rejected alternatives |
| 7. Verify exact evidence | Can someone reproduce each material claim? | Frames, filters, fields, timestamps, and bytes |
| 8. Report the boundary | What is proven, likely, and still unknown? | Conclusion, coverage, limitations, and next capture |
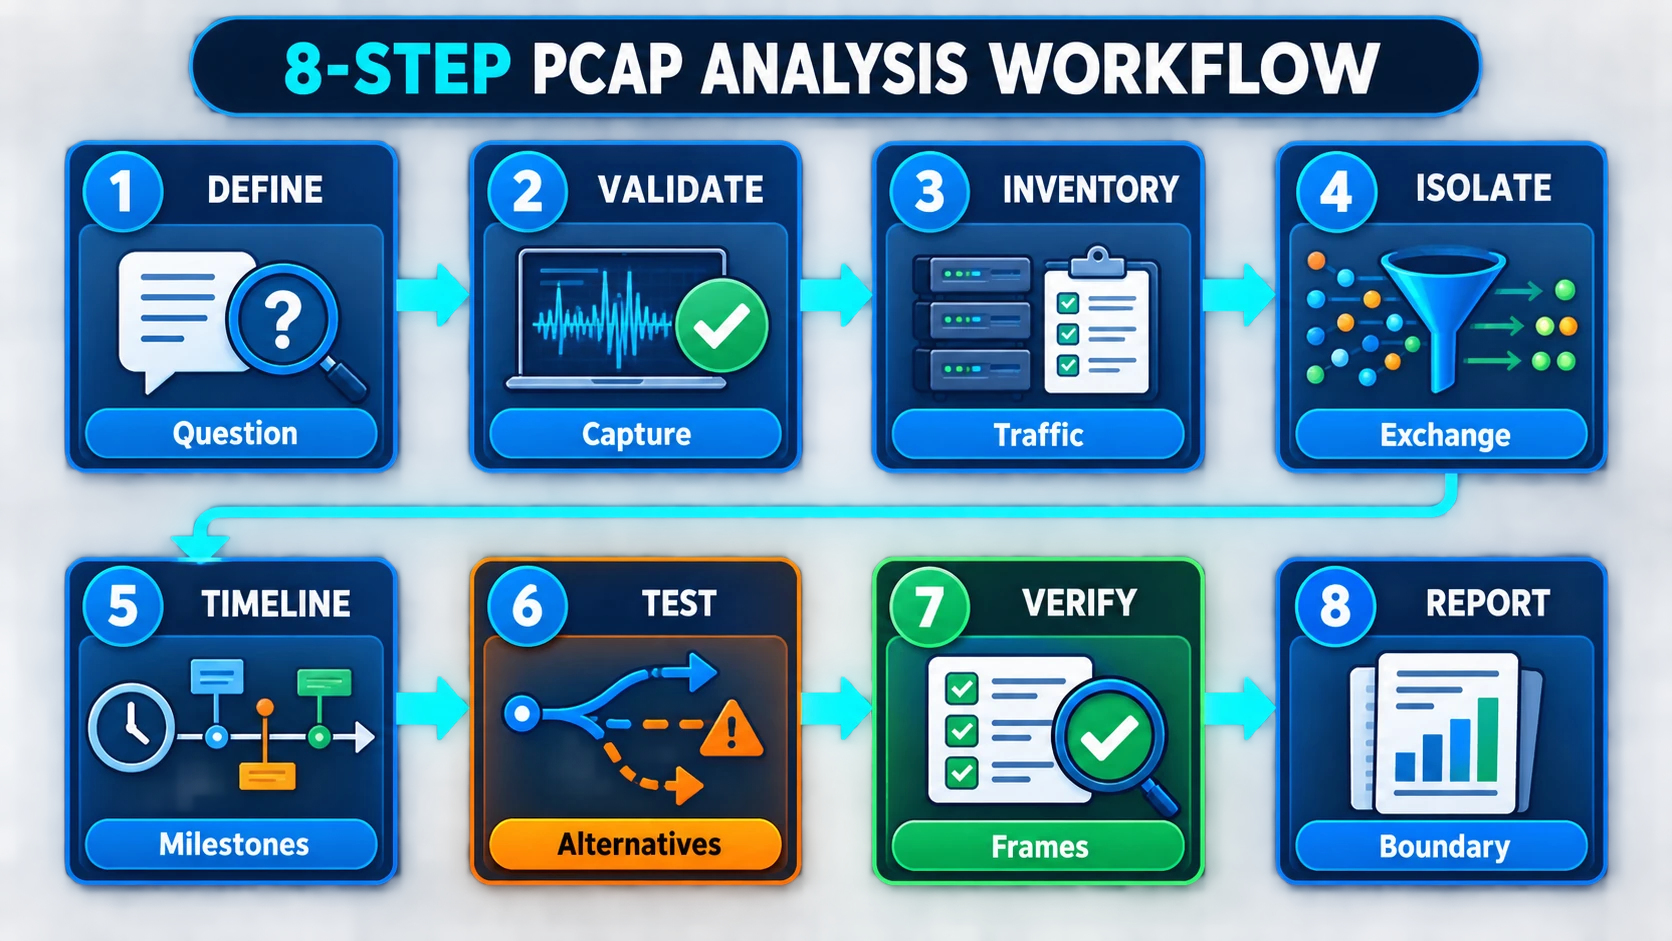
The workflow narrows progressively. It does not jump from opening a file to writing a conclusion.
1. Define the incident before opening the file
“Analyze this PCAP” is not a useful investigation question. Replace it with something an exchange can answer:
- Why did client
192.0.2.25fail to authenticate between 10:14 and 10:16? - Did the network cause the 12-second application delay?
- Is host
198.51.100.8beaconing to an external service? - Why did one TLS connection reset while comparable connections succeeded?
Record the reported symptom, affected endpoint, approximate time, expected behavior, and a known-good baseline if one exists. Do not require the person collecting the trace to know the decisive frame or flow in advance. Discovery is part of the analysis.
2. Check whether the capture can answer the question
A packet analyzer only sees the packets presented to it. Before interpreting protocol behavior, establish:
- where the capture was taken
- which interface, VLAN, tunnel, namespace, or cloud mirror supplied it
- whether both directions are visible
- whether a capture filter or packet slicing removed required data
- whether the capture process reported dropped packets
- whether NIC offloading changed checksums, segmentation, or packet sizes
- whether timestamps from multiple capture points share a trustworthy clock
In Wireshark, start with Statistics > Capture File Properties and the file metadata. On the command line, capinfos capture.pcapng gives a compact summary of packet counts, duration, interfaces, timestamps, and file properties.
Missing packets do not merely reduce detail. They can reverse a conclusion. An acknowledged byte range whose original data packet is absent may indicate a capture gap, not network loss.
3. Build a traffic inventory
Do not inspect individual frames until you know the shape of the capture. Useful first views include:
- protocol hierarchy
- endpoints and conversations
- packet rate over time
- TCP connection outcomes
- DNS names and responses
- TLS server names and versions where visible
- retransmissions, resets, ICMP errors, and other analysis flags
In Wireshark, the Statistics menu exposes these summaries. With TShark, useful starting commands include:
tshark -r capture.pcapng -q -z io,phs
tshark -r capture.pcapng -q -z endpoints,ip
tshark -r capture.pcapng -q -z conv,tcp
These are orientation tools, not conclusions. A high retransmission count across an entire file may combine healthy background traffic, repeated capture artifacts, and one affected application.
4. Isolate the exchange that represents the symptom
Use the incident facts to reduce the search space. Common selectors include endpoint, port, protocol, time window, DNS name, TLS server name, transaction identifier, and TCP stream.
Examples in Wireshark:
ip.addr == 192.0.2.25
dns.qry.name == "api.example.test"
tls.handshake.extensions_server_name == "api.example.test"
tcp.stream == 42
frame.time_relative >= 12.5 && frame.time_relative <= 20
Prefer selectors that correspond to the user-visible event. If a client retries three times, keep all three attempts long enough to compare them. The successful retry may explain the failed baseline better than the failure alone.
5. Build a transaction timeline
For application and network troubleshooting, reduce the selected exchange to milestones:
- DNS query and response
- TCP SYN, SYN/ACK, and ACK
- TLS ClientHello, ServerHello, and handshake outcome
- application request
- first application response byte
- transfer and acknowledgment behavior
- FIN, reset, timeout, or retry
Now measure the gaps between milestones. A slow page may spend 15 ms on DNS, 25 ms establishing TCP, 40 ms on TLS, and 4.8 seconds waiting after the request reached the server. Calling that “network latency” would be wrong even though the evidence came from a network trace.
Use TCP stream graphs, delta-time columns, request and response identifiers, and comparable successful transactions. When the payload is encrypted, transport timing and visible handshake metadata can still establish where the delay begins, even if they cannot explain what the application did internally.
6. Test competing explanations
Good PCAP analysis is not a hunt for one confirming packet. Write down plausible causes and ask what each predicts.
For a failed TLS connection, alternatives might include:
- client abort after receiving a certificate or alert
- server or intermediary reset
- missing reverse-path packets in the capture
- retransmission timeout before handshake completion
- MTU or fragmentation problem
- policy device terminating the connection
- application retry unrelated to the observed reset
Look for contradictions. If the same server completes TLS successfully through the same capture point seconds later, a universal server outage is less likely. If every failed attempt stops after the same packet size, path MTU deserves attention. If the receiver acknowledges bytes that the capture never saw, capture completeness is in question.
7. Preserve exact packet evidence
A material finding should be reproducible. Record:
- exact frame numbers or a narrow frame range
- the display filter or selector used to retrieve them
- stream or transaction identity
- timestamps and direction
- decoded fields supporting the observation
- relevant bytes when the field decode is disputed
- coverage and capture limitations
Separate observation from interpretation. For example:
Frames 812-815 show the client request reaching the server and no TCP recovery event before the response begins 4.82 seconds later. Comparable requests in streams 18 and 23 receive a first response within 70 ms. The capture supports server-side or downstream service wait, not path loss, for this transaction. It does not identify which server component consumed the time.
That statement is stronger than “the server was slow.” It says what the packets prove and where attribution stops.
8. Write the report another team can use
A concise packet-analysis report should contain:
- the incident question
- the capture position and quality boundary
- the affected transaction or streams
- the conclusion and confidence
- exact supporting packet evidence
- alternatives tested and why they were rejected or retained
- what remains unknown
- the next capture point, system check, or owner
The goal is not to paste every statistic. It is to compress the investigation without disconnecting the answer from its proof.
Wireshark, online analyzers, and automated investigation
Use Wireshark when you need unrestricted manual decoding, filters, stream inspection, and graphs. Use TShark when the same dissectors need to run repeatably from a terminal or script. The packet analysis tools comparison explains where recorders, NSM platforms, artifact tools, and enterprise analyzers fit around them.
An online PCAP analyzer is convenient when you need browser access and quick orientation. Before uploading production traffic, verify authorization, file limits, retention, deletion, model routing, and whether the result includes exact packet citations.
PacketSafari Analyzer applies the same workflow through capture-wide Triage, bounded Agent tools, exact packet evidence, and independent Verification. It is useful when the file is too large or unfamiliar for an efficient manual first pass, or when the output must become a reusable investigation record.
Whichever tool you choose, keep the same discipline: understand the capture, narrow by the reported event, compare alternatives, and make every conclusion reviewable.