
Platforms for Root-Cause Analysis in IT Teams
 Oliver Ripka
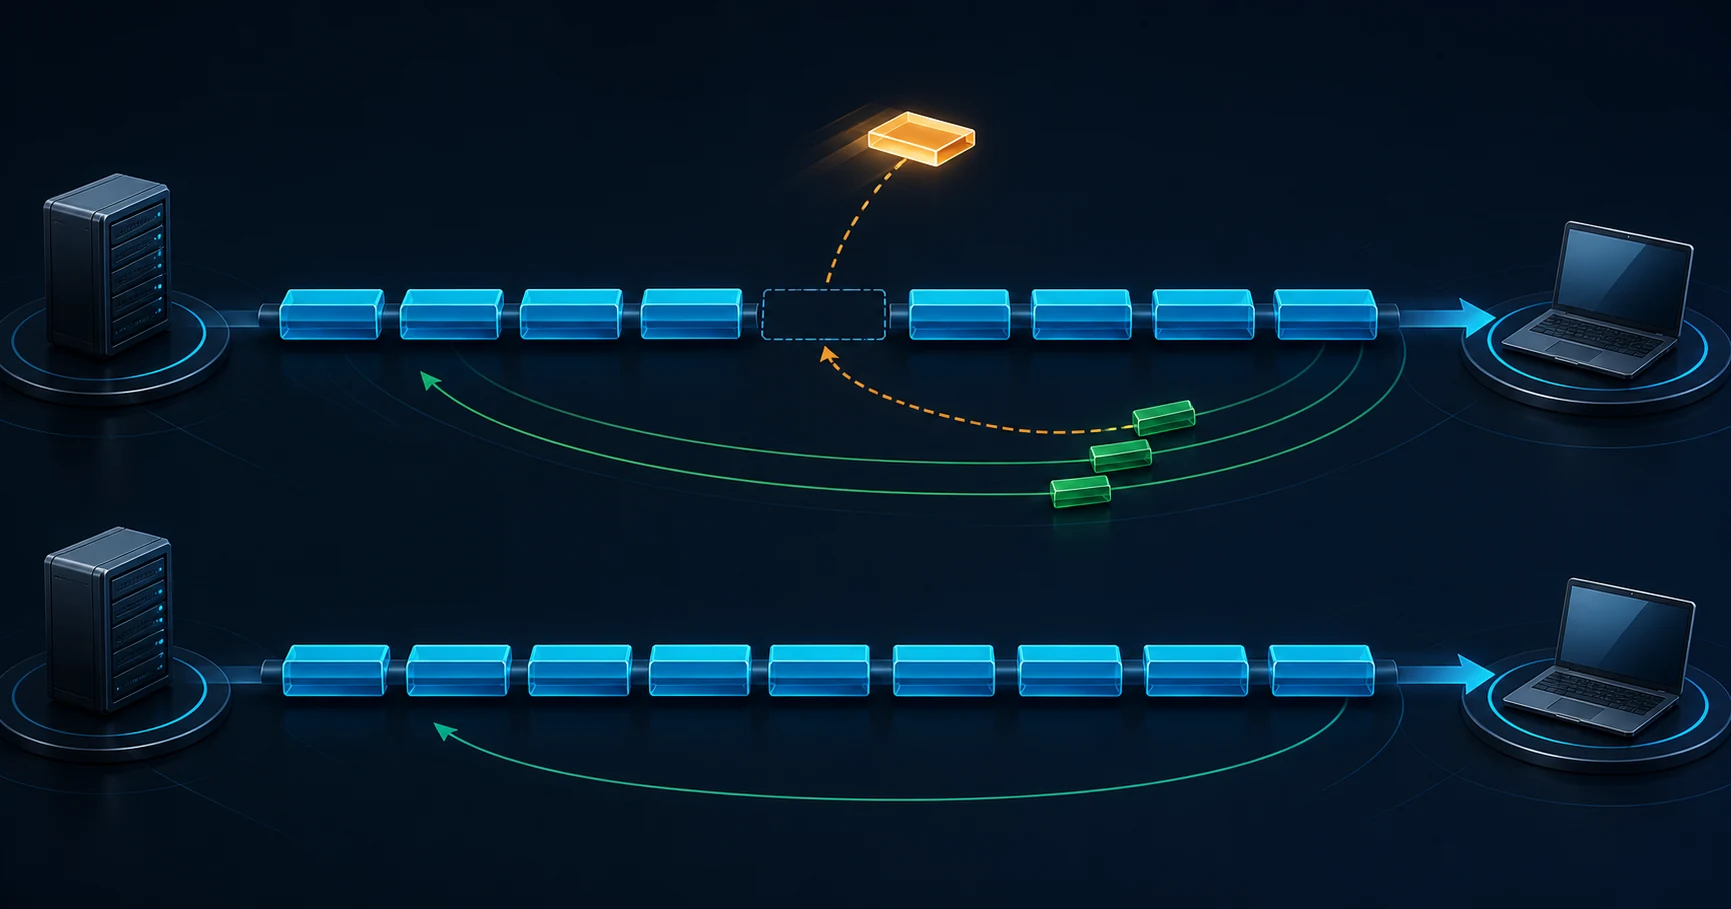
IT teams do root-cause analysis across five layers: APM, observability (metrics, logs, and traces), network performance monitoring, packet capture, and packet investigation. Platforms such as Datadog, Dynatrace, and Grafana usually answer "which service and when." Kentik and other NPM tools answer "which path." NETSCOUT, ExtraHop, and packet recorders keep the traffic. Wireshark or PacketSafari prove what actually happened on the wire. Most incidents are solved in the first two layers. Packets matter when ownership is disputed or the telemetry disagrees.
The goal is not to buy every layer. It is to know which layer is enough for a given question, and to make the handoff between teams cheap when it is not.
The RCA stack at a glance
| Layer | Example platforms | Answers well | Usually cannot answer |
|---|---|---|---|
| APM | Datadog APM, Dynatrace, New Relic, Splunk AppDynamics | Which service, endpoint, or dependency is slow; code-level spans | What the network did between instrumented hops |
| Observability (metrics, logs, traces) | Grafana with Prometheus, Loki, and Tempo; Datadog; Splunk | Resource pressure, error rates, correlated events over time | Behavior of uninstrumented devices, middleboxes, or peers |
| Network performance monitoring | Kentik, Datadog Cloud Network Monitoring, SolarWinds NPM, Cisco ThousandEyes | Path, flow, interface, routing, and synthetic test health | Exact transport behavior of one failing transaction |
| Packet capture and packet-based NPM | NETSCOUT nGeniusONE and InfiniStreamNG, ExtraHop RevealX, Endace, Arkime | Continuous packet-derived records and retained traffic for later retrieval | A written, reviewed explanation of one incident |
| Packet investigation | Wireshark and TShark, PacketSafari | Exact frames, timing, protocol state, and a cited conclusion | Fleet-wide trends or traffic that was never captured |
Capabilities overlap at the edges and change between releases. Check current vendor documentation for the specifics of any platform you evaluate.
APM: start where the user feels it
APM platforms such as Dynatrace, Datadog, New Relic, and Splunk AppDynamics follow requests through instrumented services. When a trace shows that 4.8 of 5 seconds were spent in a database call, the root cause sits with the database owner. No packets are needed.
APM is enough when:
- the slow or failing span is inside instrumented code
- the dependency that consumed the time is identified
- the application team owns the fix
APM is not enough when the trace shows time "on the network" between two spans, a client span is long but the server span is short, or the peer is a third-party service, appliance, or legacy system with no agent.
Observability: correlate the symptom with pressure
Metrics, logs, and traces in platforms like Grafana, Datadog, or Splunk let teams align a latency spike with CPU saturation, garbage collection, connection-pool exhaustion, a deployment, or an error burst. This is often where RCA is completed: a change or a saturated resource lines up exactly with the symptom.
The boundary is instrumentation. Observability explains systems that emit telemetry. Load balancers, firewalls, WAN links, and peers that emit little or nothing remain gaps, and "the network" becomes the default suspect for anything unexplained.
Network performance monitoring: localize the path
NPM platforms such as Kentik, SolarWinds Network Performance Monitor, Datadog Cloud Network Monitoring, and ThousandEyes use flow records, device telemetry, routing data, and synthetic tests. They show whether a path, interface, region, or provider degraded, and when.
NPM is enough when the evidence is unambiguous: an interface saturated, a route changed, a provider's path lost packets, and the timing matches the incident.
It is not enough when flows look healthy but one application still fails, when synthetic tests pass while real users suffer, or when the question is about a specific transaction's handshake, retransmissions, window behavior, or reset. Flow and synthetic data are summaries. They do not contain the exchange.
Packet capture platforms: keep the evidence
Packet-based NPM and recording platforms keep traffic available. NETSCOUT nGeniusONE uses packet-derived data from InfiniStreamNG and vSTREAM for service assurance and session analysis. ExtraHop RevealX combines transaction records, NPM, NDR, and optional packet forensics. Endace and Arkime focus on retaining and retrieving full packets.
These platforms make later investigation possible. If the incident window is retained, a team can export the exact sessions instead of waiting for the problem to recur. They also provide continuous packet-derived context that a one-off capture lacks.
What they usually do not produce on their own is a reviewed explanation of one incident with alternatives ruled out and ownership stated. That is analyst work, or the job of an investigation layer.
Packet investigation: prove the mechanism
Wireshark remains the reference for inspecting exact frames, fields, streams, and TCP behavior. A skilled analyst can settle most transport disputes with it. The cost is time and scarce expertise, especially when the decisive exchange is buried in a large capture.
PacketSafari investigates a selected PCAP after capture. Its Core Engine and Triage build a capture-wide Evidence Map, and Agent investigates the specific RCA question using bounded packet tools. Findings cite exact frames, filters, streams, and timestamps, state coverage and uncertainty, and pass through a separate Verification step before the Final Report. It is not continuous monitoring or a capture appliance. It works with the PCAP the team exports from tcpdump, a recorder, or a cloud mirror.
When packets are actually needed
Escalate to packets when one of these is true:
- Ownership is disputed. APM says the network, NPM says the application.
- Telemetry disagrees with users. Dashboards are green while transactions fail.
- An uninstrumented hop is in the path. A proxy, load balancer, firewall, or SASE edge may be involved.
- Behavior is transport-specific. Resets, retransmissions, zero windows, TLS alerts, or MTU problems.
- The decision is expensive. A hardware swap, a provider escalation, or a rollback needs proof.
Skip packets when a trace, metric, or change record already explains the timing and the owner accepts it. Packet work is valuable precisely because it is reserved for the questions other layers cannot settle.
The TCP retransmission analysis guide and the slow application troubleshooting playbook show what the packet layer adds once you get there.
Team workflow and handoff
RCA fails most often at the handoff, not in any single tool. A practical flow:
- Application or SRE team identifies the affected service, endpoint, time window, and trace IDs in APM.
- Network team checks NPM for path, interface, and flow anomalies in that window.
- If unresolved, the team that owns traffic access retrieves or captures a bounded PCAP: affected client and service, both directions, a healthy baseline, and capture position recorded.
- Packet investigation produces a finding with cited frames, explicit coverage, and an ownership direction: network primary cause, contributing factor, no captured network fault, or inconclusive.
- The owning team acts on the finding, and the evidence stays attached to the incident record.
Pass forward the minimum each step needs: service name, client and server addresses, timestamps in UTC, trace IDs, and the specific question. "Users say it is slow" is not a packet question. "Why does the first response byte arrive 5 seconds after the request on stream 19?" is.
The network observability, NPM, and APM ecosystem page maps how specific platforms hand off to packet investigation, and network root-cause analysis describes the PacketSafari workflow for that last step.
How to evaluate RCA platforms
Pick two recent incidents: one that telemetry solved quickly, and one where teams argued about ownership. For each candidate platform, ask:
- Which of the two incidents could it have resolved, and how quickly?
- Where does its visibility stop, and does it say so?
- Can it export evidence another team can check independently?
- Does it name a time window and scope tight enough to guide packet capture?
- For packet tools, does the result cite frames and state an ownership direction?
Most IT teams need a strong APM or observability platform, some form of NPM, a way to retain or capture packets at critical boundaries, and a packet investigation method for disputed cases. Buy depth where your incidents actually stall.
For what makes the output of that last step usable, read tools for actionable evidence in network analysis. To test packet investigation on a disputed incident, evaluate PacketSafari with a representative capture.